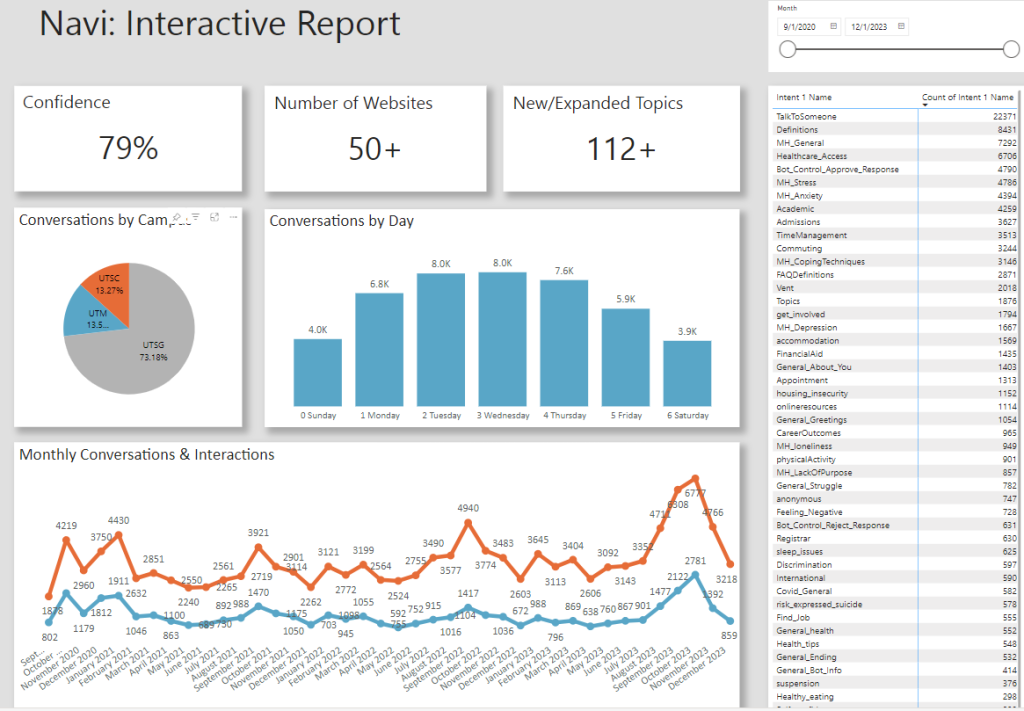
This past year Student Experience introduced the PowerBI Dashboard for Navi. This dynamic tool elevates knowledge sharing, offering stakeholders a real-time panorama of student insights. Updated monthly, the dashboard allows users to discover trends in topics of discussion, understand how usage fluctuates throughout the year and better understand the scope of Navi’s content. For instance, by filtering terms like “homesick,” they can discern monthly message frequencies and identify patterns. Beyond this, the dashboard unveils the number of conversations, campus specifics and more, furnishing staff with comprehensive data.
This information is not merely statistical; it’s a compass guiding the continuous enhancement of Navi. This data empowers the creation of programs and services attuned to students’ evolving needs.